Months to deploy.
Black box results.
Someone else's cloud.
There's a better way.
OpenRetailScience is open source retail analytics that runs in your database, handles billions of rows, and gives you back control of your KPIs.
What's included
A complete toolkit for retail analytics — from customer segmentation to revenue trees. Every module is tested, documented, and ready to use.
Your cloud, your data
Runs in your database. No data leaves your environment. Works with ~20 backends from Snowflake to SQL Server, Databricks to BigQuery.
Value in days, not years
Pre-built modules for the analyses retailers rebuild over and over: churn, gain-loss, cross-shop, segmentation, revenue trees, and more.
Own your KPIs
No black boxes. Every calculation is open source, auditable, and yours to extend. No vendor lock-in, no dependency on a third party's roadmap.
Built for scale
The heavy lifting happens in your database. Python handles orchestration. Tested with retailers running billions of rows of transaction data.
Built for production
~20
Database backends supported — Snowflake, Databricks, BigQuery, SQL Server, and more
Billions
Of rows handled. The heavy lifting happens in your database, not in Python
Days, not years
From data to business value. Pre-built modules for the analyses you keep rebuilding
Open Source
Fully open source — no vendor lock-in, no black boxes, no data leakage
See it in action
From quick analyses to end-to-end workflows, see what you can build.
Analysis
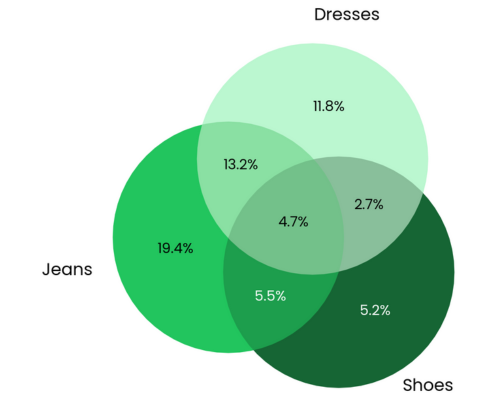
Cross-shop analysis
Understand how customers shop across categories, brands, or stores with automated Venn diagrams and overlap metrics.
Visualization
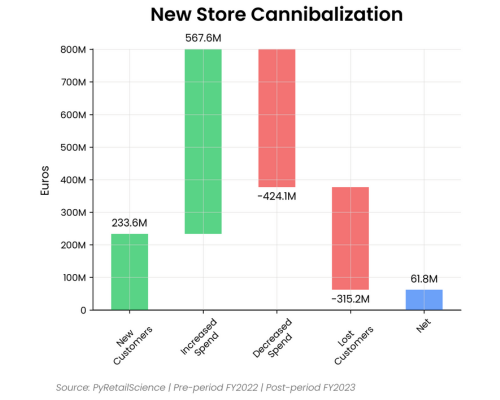
Professional charts
Waterfall, cohort, heatmap, time series, and more — all styled consistently and ready for stakeholder presentations.
from openretailscience.analysis import customer
from openretailscience.plots import histogram

dbp = customer.DaysBetweenPurchases(df)
churn = dbp.purchases_percentile(0.8)
histogram.plot(df=dbp.purchase_dist_s, title=f"Churn: {round(churn)}d")
Workflow
Composable workflows
Chain modules together. Use the output of one analysis as input for another to build complete analytical pipelines.
Your database. Your analytics. Get started.
Install OpenRetailScience and run your first analysis in minutes. Open source, well-tested, and ready for production.
$ pip install openretailscience