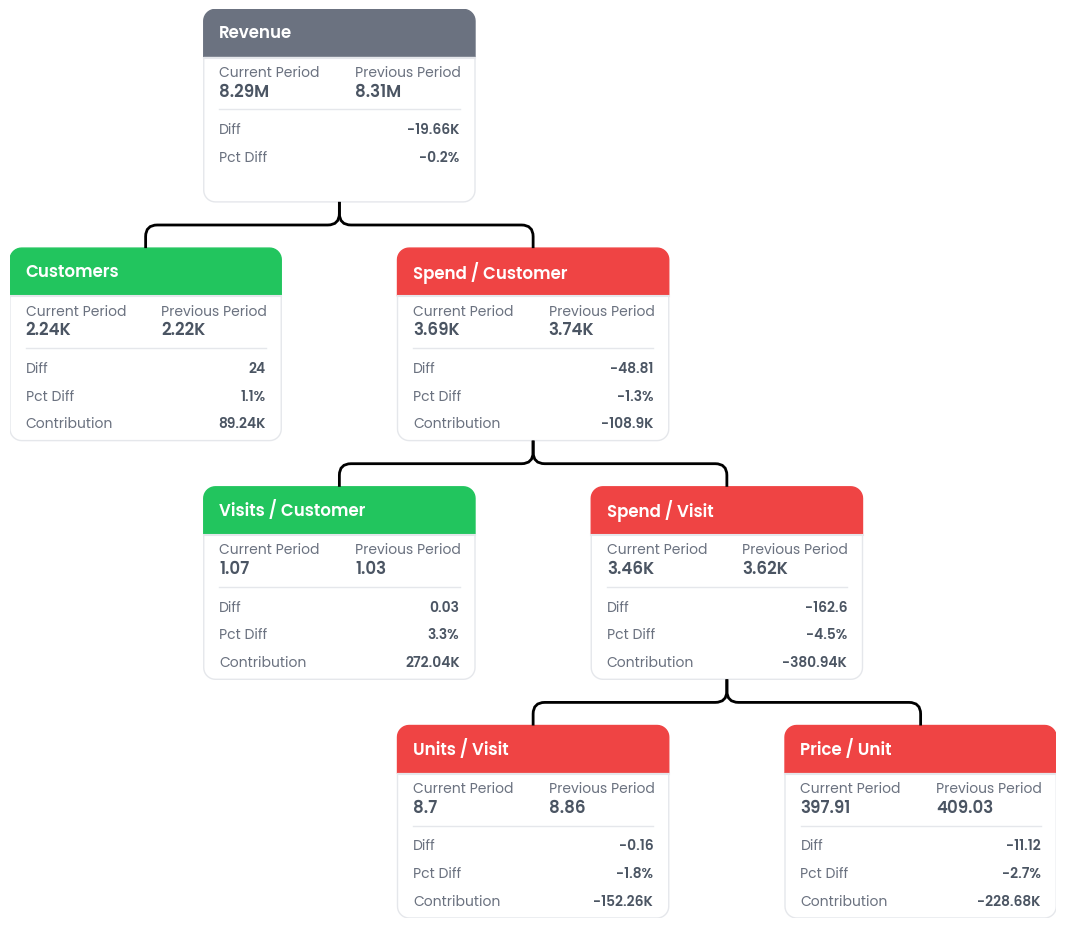
Revenue Tree
Overview
The Revenue Tree is a hierarchical breakdown of factors contributing to overall revenue, allowing for detailed analysis of sales performance and identification of areas for improvement. It is also know as a KPI tree or sometimes as a driver tree.
In this notebook, we'll look at a quick overview of how to generate a revenue tree.
Setup
Here we'll create some simulated data to demonstrate the code. You do not need to know this to perform segmentations.
import pandas as pd

df = pd.read_parquet("../../data/transactions.parquet")
df.head()
| transaction_id | transaction_date | transaction_time | customer_id | product_id | product_name | category_0_name | category_0_id | category_1_name | category_1_id | brand_name | brand_id | unit_quantity | unit_cost | unit_spend | store_id | |
|---|---|---|---|---|---|---|---|---|---|---|---|---|---|---|---|---|
| 0 | 16050 | 2023-01-12 | 17:44:29 | 1 | 15 | Spawn Figure | Toys | 1 | Action Figures | 1 | McFarlane Toys | 3 | 2 | 36.10 | 55.98 | 6 |
| 1 | 16050 | 2023-01-12 | 17:44:29 | 1 | 1317 | Gone Girl | Books | 8 | Mystery & Thrillers | 53 | Alfred A. Knopf | 264 | 1 | 6.98 | 10.49 | 6 |
| 2 | 20090 | 2023-02-05 | 09:31:42 | 1 | 509 | Ryzen 3 3300X | Electronics | 3 | Computer Components | 21 | AMD | 102 | 3 | 200.61 | 360.00 | 4 |
| 3 | 20090 | 2023-02-05 | 09:31:42 | 1 | 735 | Linden Wood Paneled Mirror | Home | 5 | Home Decor | 30 | Pottery Barn | 147 | 1 | 379.83 | 599.00 | 4 |
| 4 | 20090 | 2023-02-05 | 09:31:42 | 1 | 1107 | Pro-V Daily Moisture Renewal Conditioner | Beauty | 7 | Hair Care | 45 | Pantene | 222 | 1 | 3.32 | 4.99 | 4 |
Some details about the data
print(f"Number of unique customers: {df['customer_id'].nunique()}")
print(f"Number of unique transactions: {df['transaction_id'].nunique()}")
Number of unique customers: 4250
Number of unique transactions: 25490
In this example we compare February 2023 with March 2023 to see how revenue changed month on month and which factors drove it. Each row is labelled with its month; RevenueTree keeps only the rows whose label matches p1_value or p2_value.
from openretailscience.analysis import revenue_tree

df["transaction_date"] = pd.to_datetime(df["transaction_date"])
df["month"] = df["transaction_date"].dt.strftime("%Y-%m")

rev_tree = revenue_tree.RevenueTree(
    df=df,
    period_col="month",
    p1_value="2023-02",
    p2_value="2023-03",
)
The default view of the KPIs can be difficult to view. Use the draw_tree method to visualize the data as a tree.
rev_tree.draw_tree()
<Axes: >